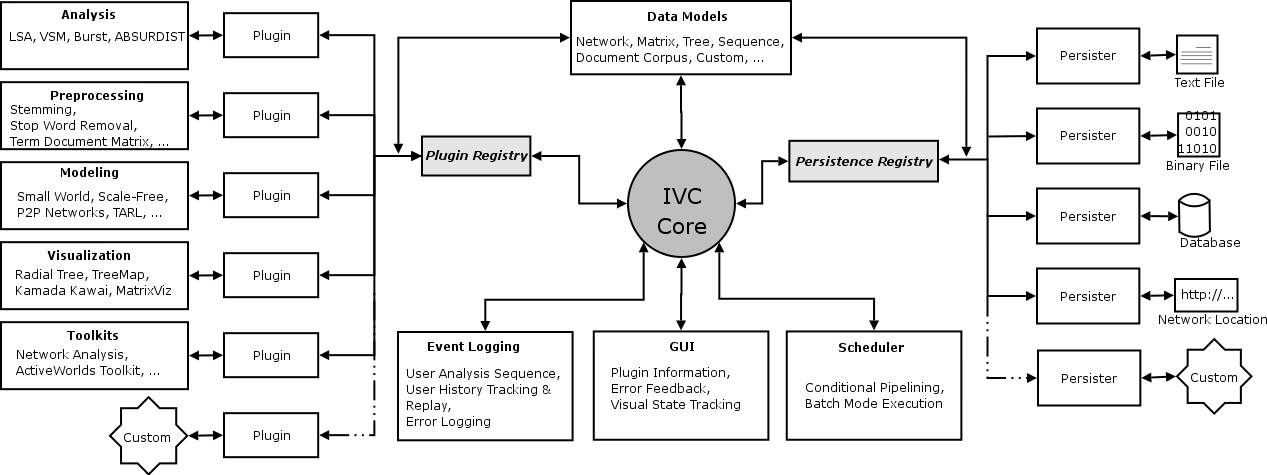
Architecture of the IVC Software Framework. Click to enlarge.
This session will introduce participants to data modeling, analysis and visualization using the InfoVis Cyberinfrastructure (IVC) Software Framework. The algorithms will be primarily networks-based, i.e. they deal with modeling, analysis and visualization of data that represents entities (e.g.: people) and their relationships (e.g.: social relations among people). A brief overview will be given about the software framework, which enables diverse kinds of analysis, modeling and visualization algorithms to be plugged-in with minimal work. This framework facilitates sharing of knowledge among algorithm developers, lay users and educators alike.
Architecture of the IVC Software Framework. Click to enlarge.
The IVC is a Plug-in based architecture meaning that it allows diverse kinds of software components to be plugged-in and unplugged as needed without significant effort. The idea is similar to using electrical appliances at home; one can plug-in any electrical appliance (such as an Iron, Hair-dryer or a Television) into the power socket and it works. This is because all these appliances know how to use that same power socket. The power-socket offers a standard interface to every appliance thus making it really simple to plug them in. In the same manner, the IVC core (shown as grey circle in the center) presents a common interface to different types of algorithms. Therefore, so long as an algorithm knows how to talk to the IVC core, it can be plugged-in to the IVC and made to work. All the algorithms shown on the left side in the figure are plugged-in this way.
Any algorithm that analyzes or visualizes data needs to be able to work with that data in a meaningful manner. The IVC provides algorithms with a variety of ways to look at data. Data can be stored as a simple text file on one's computer, it may be a database sitting on a server, or it may be located in another computer on the west coast of the US. Again, the IVC core presents a standard interface which algorithms can use to read data from a variety of sources. Hence using many different types of file formats becomes really simple. All the persisters shown on the right side in the figure exist for this purpose.
All this complexity is hidden underneath an easy-to-use Graphical User Interface or GUI (shown below the IVC core in the figure), which provides a point-and-click way of using these algorithms. Thus, the end-user is freed from worrying about the particulars of the software.
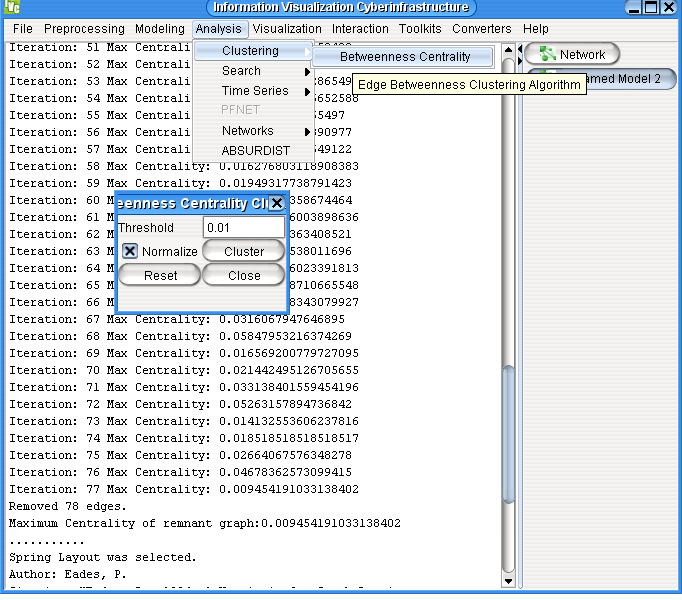
You can see that many links of the generated graph have been removed. The analysis algorithm you just used (Betweenness Centrality) removes links of highest betweenness one by one until a certain threshold is reached. The betweenness of a link determines how important it is in the network. By the time the threshold is reached, the weakest links of the network have been removed. The nodes and remaining links that form small groups are called clusters . You can see the difference in the structure of the network before and after this analysis by comparing the two visualizations.
Radial Graph
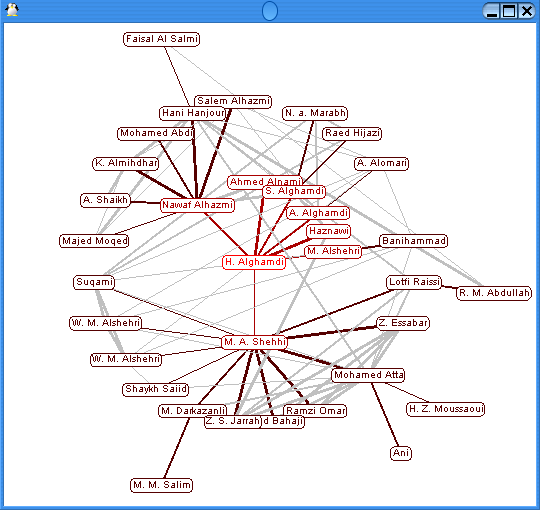
Using such a visualization, the connections between people are clearly revealed. A similar network was used by the Bush administration to capture Saddam Hussein by following his social connections.
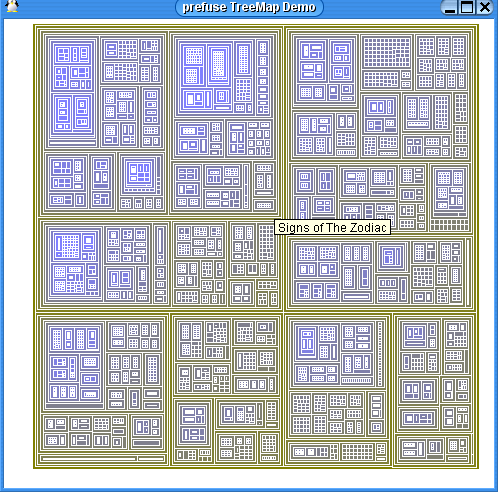
TreeMap Demo
Now we will use a different visualization on the same data.
Balloon Graph
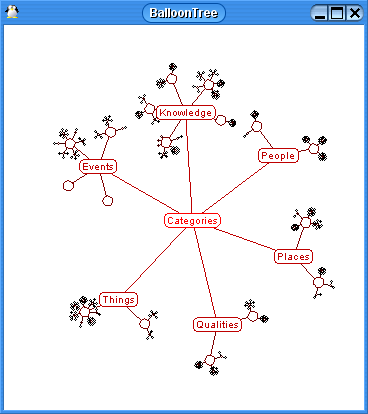
Clearly, the Balloon Graph is easier to read than the TreeMap. However, the TreeMap gives you a global overview of everything - this is something you cannot get using the Balloon Graph.
The learning modules in the IVC aim to encourage the exploration, application, evaluation, and comparison of algorithms.