 |
INTRODUCTION
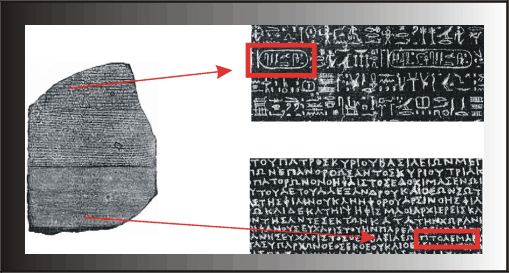
The end of the sixth century A.D. saw the demise of the people who could read and write Egyptian hieroglyphics. For more than almost a millennium and a half the meaning of these symbols remained hidden, though speculation of their significance ran the gamut from decorative to mystical, and to a devoted few, a system of writing. A breakthrough came when a stone bearing an inscription in three different scripts---hieroglyphic, demotic, and Greek---was discovered. It was presumed that the three different scripts bore the same message, but the stone was broken and many passages were unreadable--there were only 14 lines of hieroglyphs, but 32 lines of demotic and 54 lines of Greek. The hieroglyphs corresponded to the last half of the Greek, though both scripts were damaged badly as the scripts neared the edges of the stone.
 |
The British physicist Thomas Young (1773-1829) was the first to successfully and systematically begin decipherment of the stone. His procedure was to find a Greek word that occurred sufficiently often in the stone, like the Greek equivalent for "and" and "king", and match it with words that occurred with the same frequency in the demotic. Jean François Champollion (1790-1832), a French Egyptologist, then employed the same process with the Greek and hieroglyphics, matching the Greek and Egyptian spellings of Ptolomy (see Fig. 1).
This story provides a nice metaphor for the state of affairs we find ourselves in--we are awash in data. So much data, in fact, that we are becoming unable to use it, let alone discover if any part of it contains useful information.
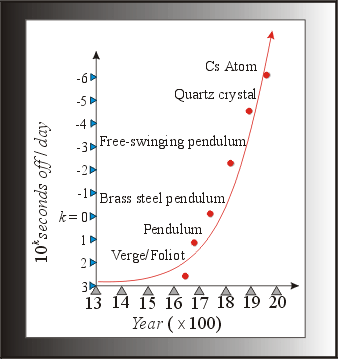
We, as computer scientists, and in particular, database researchers, are partly to blame: data generation and acquisition have become accessible to essentially everyone (see Fig. 2). This, no doubt, contributes to the well-accepted assumption that the world's amount of data doubles roughly every year, viz., secondary storage is relatively inexpensive, "wizard" driven relational database systems are both plentiful and affordable, and the ever growing number of web users. We are, however, only the enablers. |
 |
Industry itself is who is culpable, reacting to a rapidly changing business environment. With an estimated 80
% of Fortune 500 companies currently implementing some kind of data mining project, the marketplace drives research in this area. Businesses are hungry for the promised, though somewhat illusory, fruits of "knowledge discovery": what was once simply used to manage business, data has become a tool for retaining customers, called customer vulnerability analysisWhat is knowledge discovery? The most often cited definition (though in our mind a goal) is:
Knowledge discovery in databases is the non-trivial process of identifying valid, novel, potentially useful, and ultimately understandable patterns in data[1].
A number of these terms have taken on special meaning, so we examine them more closely to get a better idea of what this definition means.
By data, we mean, almost always, a relational database system. The preference of this model speaks more to its prevalence--its theoretical and commercial success--than how well it supports discovering information. Generally, these systems are substantially large: billions of records. Further more, these records, likewise, are quite wide, e.g. Walmart has upwards of one million products with descriptions.
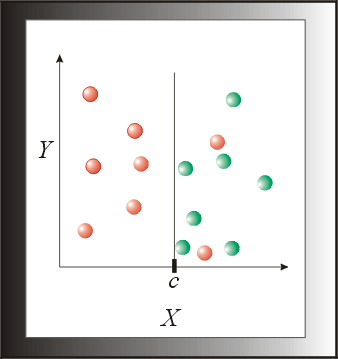
Pattern is less well-defined and sought either positively or negatively. A pattern is significantly smaller in size than the data it was formed from, but still possess some or most of the desired "information" (See Fig. 3).
 |
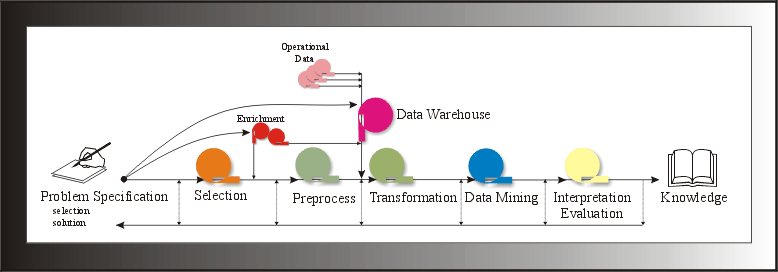
Validity and novelty speak to how potentially useful the information is. Validity is a real concern, since there is not any means of verifying the newly discovered information. Certainly, in the confines of real-world use, noise is a ubiquitous problem. Thus, conclusions that are drawn from discovered knowledge may be (and the literature abounds with) spurious results[2]. The novelty aspect means the information most likely could not be obtained by other means (for instance, statistics) and patently obvious information (for example, "unmarried men are bachelors") is eschewed. Understandable speaks mostly to the business component of this area. With business cycles spanning what Lou Gerstner at IBM coined as the "web year" (three months), decisions brought about by knowledge discovery need to be made by the same people who receive the results of knowledge discovery--there are no intermediary experts providing interpretations of data. Lastly, process is more of an apologia about current state of affairs than anything else. Knowledge discovery is a process, loosely coupled to some sequence of events leading to knowledge--but this rarely, if ever, runs linearly (see Fig. 4.).
Identifying lies at the heart of the matter, the key element of knowledge discovery in databases (KDD) called interestingness[3]. Interestingness is how information is identified--the degree of interest some piece of information has. While a decade's worth of research has gone into formalizing this (KDD first appeared in the literature in 1989), this has been an area of "slow progress," according to Piatetsky-Shapiro, a leading researcher in the field. As with any nascent research (and commercial) area, terms have not settled to a point where there is broad agreement on what they mean; further, being a confluence of mature disciplines, e.g., machine learning and relational database theory, there is a great deal of overlap. Thus, ambiguities arise in what is meant. We state here that we will use terminology from relational database theory and database systems. If a suitable term (or substantially better term) does not exist in this vocabulary, we will adopt the most widely accepted term.
The contributions of this dissertation lie in data mining, and so we must make clear data mining's role in KDD.
 |
The KDD Process
Though more crucial to the success of a KDD application than any other step, problem specification is usually left out of the description. We highlight what this pivotal step requires if the application is to be at all successful.
Problem Specification
KDD is not at the point where it can be blindly unleashed on the data and obtain useful results. Problem specification begins with a precise definition of the problem[4]. Following that, both the form of the solution and the data that will be used (or source) for KDD are specified. Lastly, the source is surveyed, indicating, among other things, whether the data is good enough to potentially yield an answer. Since the problem specification guides each of the major steps of the KDD process, a poor specification will only yield useless results.
Continuing the KDD Process
Once problem specification is complete, the data is selected[5] and enriched and sent to the transformation step. Enrichment is the addition of elements, like demographic data, needed to increase the likelihood of success. Typically, the selected, enriched data must be cleaned: missing or spurious values are removed, duplicates removed, and so forth. The process of cleansing data is conducted at the preprocessing
step. The transformation step converts the data to appropriate types, e.g.[6], for example, for a survey on feature selection). This is understandable, given that these two steps comprise approximately 80% of the time (human effort) taken from start to finish of the entire process[7].Once the data has been prepared, data mining takes place. At this step, models are fitted or constructed, patterns discovered, deviations detected etc. (we defer a complete discussion after finishing this KDD overview). Interestingly, this stage comprises only about 15
% of the entire time of the process. The results are next interpreted and evaluated. This is a significant step since those conducting the interpretation and evaluation are those same individuals who will put the knowledge to use; therefore, the format of the results used in this step are vastly different from the previous mining step. Note at any step that the process may turn back to any previous step or steps.Now that we have been introduced to KDD, we focus upon the data mining step.
(to be continued translating Latex2e to FrontPage 2000)
2. To better target its frequent costumers, a retail store applied knowledge discovery to its database of " loyalty cards" (cards rewarded to frequent customers for additional discounts, etc.) and found to their delight that divorced women had distinctly different purchasing habits from women who were either married or single and never married. Eventually, this information was found to be spurious--evidently, only a small fraction of the female population of loyalty card holder declared their marital status, and fewer still admitted to being divorced. One of the most famous "bad" discoveries was by Bonissone, applying knowledge discovery to the dietary habits of obese people. He erroneously concluded that diet drinks are, in part, contributors to obesity.
3. This word--interestingness--is directly from the literature and no claim is made as to its lexical legitimacy.
4. A telecommunications company wanted to address churn, but was not careful to distinguish between discovering the traits that lead to customers who churn and discovering traits that keep customers from churning. To their chagrin, they discovered unemployed octogenarians churn the most, most usually from their own, natural demise.
5. We must acknowledge here, for sake of completeness, that the data often is selected from a data warehouse. A data warehouse is generally defined to be a subject-oriented, integrated, time-variant, and non-volatile collection of data for decision support. Essentially, what this means is that data can now be used as an asset itself, rather than just the operational glue that keeps an entity running. (See W. H. Inmon, The Data Warehouse and Data Mining, Communications of the ACM, 1996, 39(11), November, pp. 49-50. W. H. Inmon has been the primary driving force behind data warehousing. For a more in-depth discussion see S. Chaudhuri and U. Dayal, An overview of data warehousing and OLAP technology, SIGMOD Record, 1997, 26(1), pp. 65-74.
6. Huan Liu and Hiroshi Motoda, Feature Selection for Knowledge Discovery and Data Mining, Kluwer Academic Publishers, 1998, Boston, MA.
7. Dorian Pyle, Data Preparation for Data Mining, Morgan Kaufmann Publishers, Inc., 1999, San Francisco, CA. This is an excellent introduction to techniques for data preparation. The presentation is not overly technical, so most readers can benefit from its content. On the other hand, there really isn't any presentation of algorithms as such, so you won't be able to have the book in one hand and your compiler in the other (what I like to do). The book includes a CD-ROM with C source code, however--but I confess I haven't even opened it.