


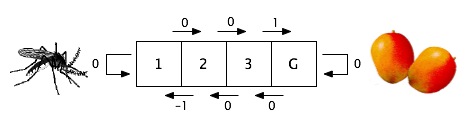
| s | a | r | Q | new | ||||||
|---|---|---|---|---|---|---|---|---|---|---|
| 1,r | 1,s | 2,r | 2,l | 3,r | 3,l | G,s | ||||
| 1 | r | 0 | 0 | 0 | 0 | 0 | 0 | 0 | 0 | |
| 2 | r | 0 | ||||||||
| 3 | r | 1 | ||||||||
| G | s | 0 | ||||||||
| 1 | r | 0 | ||||||||
| 2 | r | 0 | ||||||||
| 3 | r | 1 | ||||||||
| G | s | 0 | ||||||||
γ = .8, η = .5 and all values initialized at 0. In the chart, "new" means the reinforcement received plus the discounted maximum value of the next state. The "new" value is combined with the "old" using the learning rate to give the updated Q-value appearing in the next line of the chart.
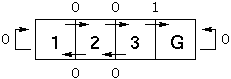
| s | a | r | Q | new | ||||||
|---|---|---|---|---|---|---|---|---|---|---|
| 1,r | 1,s | 2,r | 2,l | 3,r | 3,l | G,s | ||||
| 1 | r | 0 | 0 | 0 | 0 | 0 | 0 | 0 | 0 | 0 |
| 2 | r | 0 | 0 | 0 | 0 | 0 | 0 | 0 | 0 | 0 |
| 3 | r | 1 | 0 | 0 | 0 | 0 | 0 | 0 | 0 | 1 |
| G | s | 0 | 0 | 0 | 0 | 0 | .5 | 0 | 0 | 0 |
| 1 | r | 0 | 0 | 0 | 0 | 0 | .5 | 0 | 0 | 0 |
| 2 | r | 0 | 0 | 0 | 0 | 0 | .5 | 0 | 0 | .4 |
| 3 | r | 1 | 0 | 0 | .2 | 0 | .5 | 0 | 0 | 1 |
| G | s | 0 | 0 | 0 | .2 | 0 | .75 | 0 | 0 | 0 |