2. Longitudinal. Particles move forward/backward re wave front. Like sound (or slinky).
3. Combination waves. Both horizontal and perpendicular motion. Like familiar surface waves on water.
4. Varying number of dimensions for the medium:
March 19, 2008
For this course, no math
performance is required. Some mathematical terminology is offered
here only to be specific. The goal in intuitive understanding of sound
and its relation to cavities. A good site for visual demos about
sound is Dan
Russel's Acoustics Demos.
1. WAVE MOTION: vibration (oscillation) of particles in a medium
A. the acoustic medium must contain particles that are elastic, that is, sloshy or springlike.
B. The motion of each particle sets adjacent particles in motion. Energy is transferred over distance by local motions of particles.
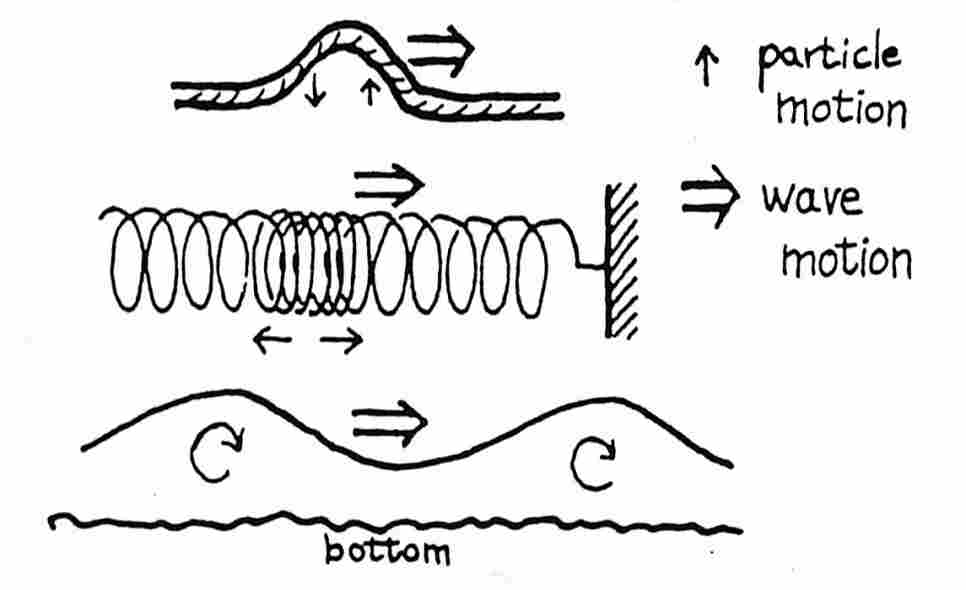
C. Types of waves: Differences in motion of particles with respect to motion of the wave front. All exhibit the same abstract properties.
1. Transverse. Particles move perpendicular to wave front. Like a wave in a rope or slinky.
2. Longitudinal. Particles move forward/backward re wave front. Like sound (or slinky).
3. Combination waves. Both horizontal and perpendicular motion. Like familiar surface waves on water.
4. Varying number of dimensions for the medium:
2. WAVE CYCLE AND GRAPH - descriptive terms
A. Period (or T) of a wave is duration between any point on a wave and the same point on the next cycle. Usually measured in milliseconds (1000 ms = 1s). Notice that there is as much negative portion as positive portion of the wave. T = 1 s/f , that is, the period of a wave is found by dividing one second into f equal fractions. That is, f*T = 1second: If the period (T) is 1/100th of a second and you have 100 of them (f), then that should take one second.
B. Frequency (f) is the number of cycles per second. Often it is measured in thousands of Hz (pronounced `Herz') = kHz. f = 1/T (that is, the number of cycles per second equals a second divided by the duration of one cycle
C. Amplitude (A) of a wave, the instantaneous pressure (or displacement) of particles in the medium. The amplitude has no relation to wave speed or its frequency. A given sound with greater amplitude sounds louder than the same sound with smaller amplitude. Greater amplitude implies more energy in the wave.
D. Velocity of wave motion (s, for speed) depends solely on the medium. Thus it is independent of A, T or f. Wave move at low velocity in a slinky but faster in air and faster still in water and steel.
3. Sound is a special case of wave motion, typically of air, in the (humanly audible) frequency range of 20 Hz--20 kHz. This figure shows a piano keyboard with at least the range of musical sounds. You can see that the musical scale is logarithmic (since equal distances correspond to equal ratios) and that the highest note on a piano is about 4kHz -- still over 2 octaves below the highest frequency we can hear (that is, 4, 8, 16 kHz). The lowest note on the piano comes close the lower limit of hearing (at 27.5 Hz).
Video of
expanding sound waves
Some
pure tones.
More pure tones and tone sweeps, etc.
4. WAVEFRONT MOTION
A. Propagation - waves keep on going once initiated by some energy source. However, in 2D or 3D media, their amplitudes get smaller over time since the energy gets spread over greater and greater width of wave front.
B. Diffraction - waves bend around corners. Low frequencies bend better than high frequencies.
C. Reflection - waves reflect partially when resistance of medium increases. Some is reflected, some continues on.
D. Additivity (or superposition). When several waves are in the same place at the same time, they just add to each other. The amplitudes (positive or negative) are just summed at each point in time. And since (+4) plus a (-4) = 0, it is possible for two sounds to add up to no sound at all! (This is the secret of noise-cancelling headphones. They use a mic to pick up the noise, turn the wave upside down (make positive values negative and negatives positive) and add the new noise to the original, and the noise disappears!)
5. SOME WAVE TYPES
Some demos of
sound spectra
A. Pure tone or `simple sound.' The wave looks like a `sinusoid'. See the second figure above.
B. Complex waves: sum of two or more sinusoids, usually harmonically related (that is, integer multiples of a `fundamental frequency', the f0).
1. harmonic sounds: sound like a hum or buzz, `tones' . These sounds have an apparent `pitch'.
2. nonperiodic sounds: eg, noise (hiss or whoosh)
3. fundamental frequency - the lowest frequency component of a complex wave, and its apparent `pitch'.
C. From Wave to Spectrum - 2 equivalent representations
Complex wave can be represented as the sum of simple components (eg, sinusoids). This technique can be done by mechanical devices (eg, in the cochlea of the ear or by electronic and computational techniques). A complex sound can be represented as the sum of a set of sinusoids (that is, the sum of a set of ``pure'' tones).
D. Spectrum Display: a graph showing the amplitudes of the sinusoidal components that are summed to equal some sound wave. This visual presentation technique can be easily interpreted by the brain (or by scientists). To do this, a sound is chopped into short segments (eg, 10 ms of the wave) and the spectrum computed for that frame. This spectrum is often called a spectral slice.
E. A spectrogram: (1) chops the wave into time segments (eg, 5 to 20 ms), (2) computes a spectrum slice for each segment, and (3) plots a series of these frames. The standard spectrogram displays 3 dimensions: time over the series of frames from left to right,. frequency from bottom to top and the energy in each freqXtime cell as darkness (darker = more energy).
In this spectrogram (of the word `phonetician'
pronounced' with artificial care), the acoustic segments are very
short - about 3 ms (that is, about 33 per 100 ms), and the
energy in each frequency is shown up to 8 kHz. The segments are
short enough to distinguish individual pitch periods (that is some
slices of each vowel show pitch pulses and others show the ringing of
the cavity). The 3 dimensions of freq band, the energy in
each band and global time can also be displayed as a 3-D graph like
this. Instead of showing energy with darkness, it is shown on the
vertical axis (and thus shown in more detail) :
The frequency scale is diagonal to the left (0-8 kHz), time is the
diagonal to the right (0.004 s to 0.952s making almost 300 separate
spectral slices) and energy is the vertical axis. This shows the same
speech sample as the spectrogram above. Obviously, this is not as
easy to read as the standard spectrogram - but probably easier than the
waveform itself.
6. SPECTRAL FILTERS
A. Filters. Since sound is always a sum of independent frequency components, specific frequencies can be added to OR removed from any sound. Various mechanical and electronic devices, called acoustic filters, can strengthen or weaken selected frequencies relative to other frequencies. Many things can be acoustic filters, for example, a physical tube, a room, a loudspeaker, a microphone, a human vocal tract, etc.
B. The human vocal tract acts like a time-varying acoustic filter for sounds generated in the larynx or elsewhere in the vocal tract. So
C. Analysis of sound using filters.
Synthesize some vowels using the Klatt speech synthesizer. Type in formant values and synthesize.
For more on speech spectra, check Port's speech acoustics page and the speech
web references on the syllabus page.